[DevOps] 모니터링 시스템 도입기 with Grafana

| 관련 블로그 글 | |
| Prometheus+Grafana+OpenTelemetry를 이용한 k8s 모니터링 | https://jm-baek.tistory.com/351 |
왜 모니터링 시스템?
※ 개인적인 의견을 기반으로 작성해 보았습니다..!!!
현재 상황
회사의 기존 플랫폼 서비스 아키텍처는 모놀리식 구조로 되어있지만,
현재 새로운 플랫폼 서비스를 개발하면서 도메인 별로 서비스를 나누게 되었다.
문제점
- 테스트 서버에 배포된 애플리케이션의 로그를 확인하려면, 매번 서버에 접속해서 명령어로 확인을 하는 불편함이 있다
(서비스가 여러 개로 되어 있어 하나씩 로그를 vi 편집기 등으로 확인한다.) - 특정 고객사에서는 설치된 서버의 리소스 상태를 확인할 수 있는 대시보드 형태의 페이지를 원하기도 했다.
- 엔지니어 및 개발자 입장에서 서버에 접속하기 전에 간편하게 확인할 수 있는 대시보드 페이지가 있으면 좋겠다고 생각했다.
결론
문제점을 고려했을 때, 로그 및 서버 리소스 등 서비스가 살아있는지 확인할 수 있는 모니터링 시스템이 있으면 좋겠다고 생각했다.
교육을 듣고 공부한 내용을 먼저 테스트 서버에서 적용해 보려고 한다.
아키텍처

환경 설정
- OS: Rocky 9
- 사용 툴: Grafana, Prometheus, Loki, Promtail, node exporter Spring Actuator
설치 방법
직접 설치를 해도 좋고, Docker를 사용해도 좋다.
단, 도커를 사용해서 설치하면 설치 순간에는 쉽겠지만 설정을 위해서 볼륨 등 도커에 대해 조금 알고 있어야 하는 부분들이 있다.
※ 참고 사이트에 들어가 보면 설치 방법에 대해 훨씬 잘 설명되어 있다. ;)
Docker 사용해서 설치
- docker run 명령어를 실행할 때, 로컬에서 도커 이미지가 없으면 Docker Hub에서 이미지를 가져온다.
Grafana
Run Grafana Docker image | Grafana documentation
Run Grafana Docker image You can use Grafana Cloud to avoid installing, maintaining, and scaling your own instance of Grafana. Create a free account to get started, which includes free forever access to 10k metrics, 50GB logs, 50GB traces, 500VUh k6 testin
grafana.com
1. To run the latest stable version of Grafana
docker run -d -p 3000:3000 --name=grafana grafana/grafana-enterprise
Prometheus
- 프로메테우스 도커 이미지 설치 사이트
(비트나미가 제공하는 프로메테우스를 사용하는게 좋다(?)
https://hub.docker.com/r/bitnami/prometheus
hub.docker.com
1. To run the Prometheus Image
Loki && Promtail
Install Loki with Docker or Docker Compose | Grafana Loki documentation
Install Loki with Docker or Docker Compose You can install Loki and Promtail with Docker or Docker Compose if you are evaluating, testing, or developing Loki. For production, Grafana recommends installing with Helm or Tanka. The configuration files associa
grafana.com
1. Create a directory
// loki 폴더 만들기 && 이동
mkdir loki
cd loki
2. loki, promtail yaml 파일 가져오기
wget https://raw.githubusercontent.com/grafana/loki/v3.0.0/cmd/loki/loki-local-config.yaml -O loki-config.yaml
wget https://raw.githubusercontent.com/grafana/loki/v3.0.0/clients/cmd/promtail/promtail-docker-config.yaml -O promtail-config.yaml
3. 도커 실행
※ 아래 볼륨 등의 설정은 상황에 맞게 수정해야한다.
docker run --name loki -d -v $(pwd):/mnt/config -p 3100:3100 grafana/loki:3.2.1 -config.file=/mnt/config/loki-config.yaml
docker run --name promtail -d -v $(pwd):/mnt/config -v /var/log:/var/log --link loki grafana/promtail:3.2.1 -config.file=/mnt/config/promtail-config.yaml
Node-exporter
https://hub.docker.com/r/bitnami/node-exporter
hub.docker.com
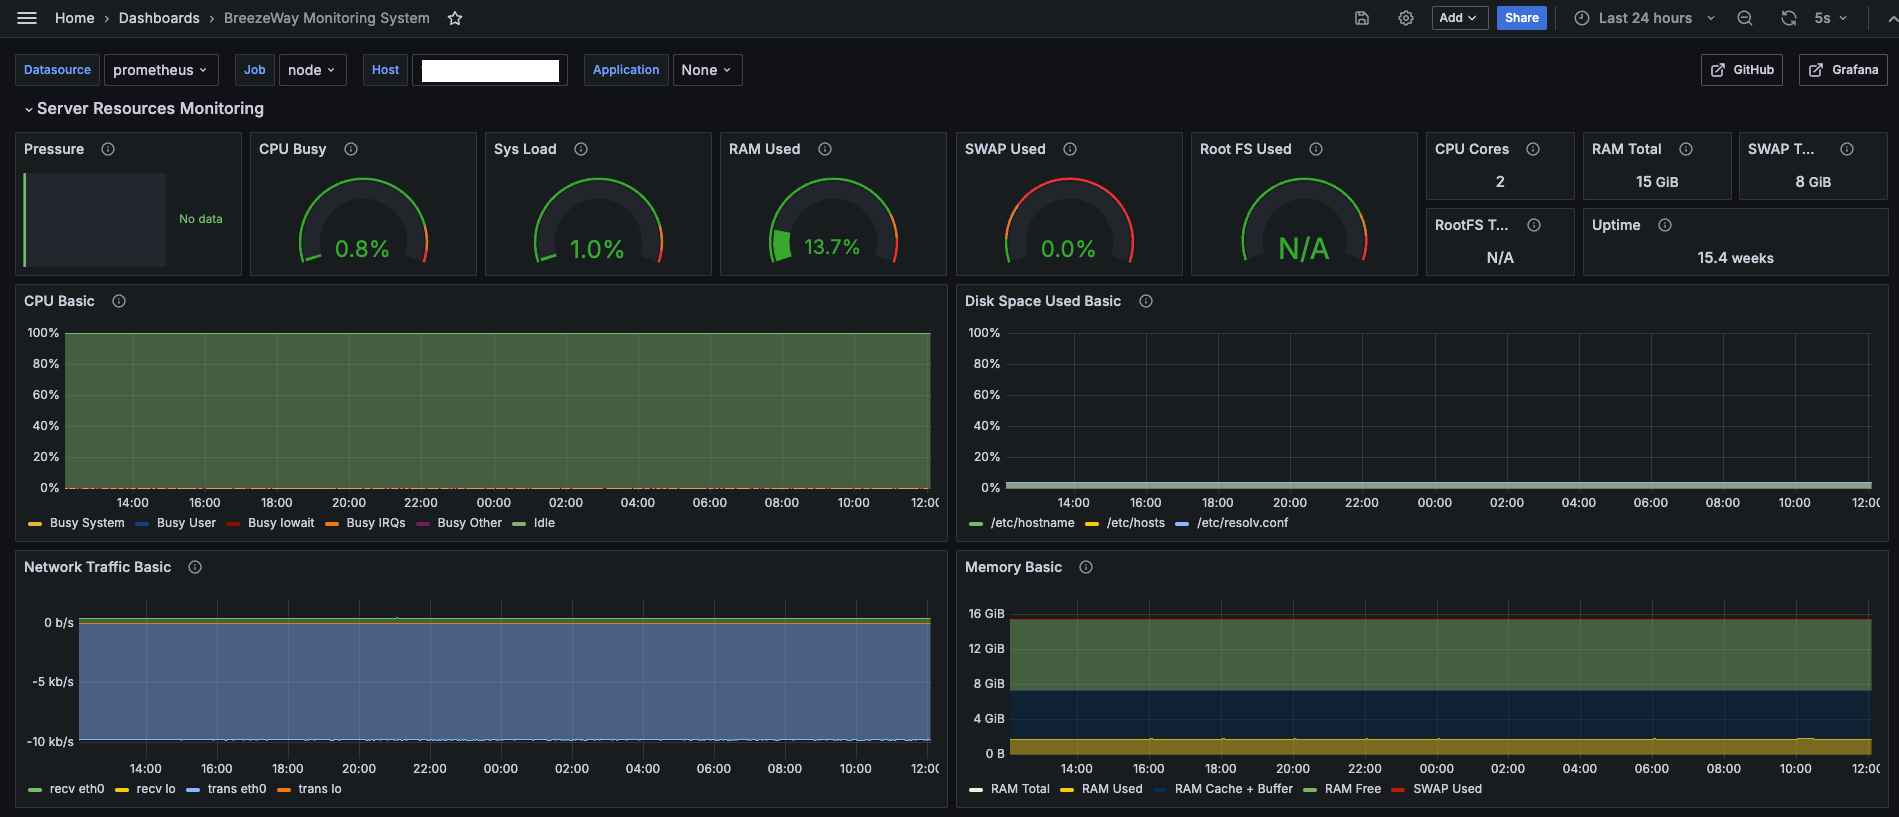
최종 확인
작업을 하면서 궁금한 부분은 가끔씩 수집이 제대로 이루어지지 않아서 N/A가 그라파나에 표시 될 때가 있다.
이유는 정확하게 파악하지 못 했지만... 시간이 지나면 다시 메트릭이 수집되어 표시 되는 것을 확인할 수 있다.ㅠㅠ

참고 사이트
Install Loki with Docker or Docker Compose | Grafana Loki documentation
Install Loki with Docker or Docker Compose You can install Loki and Promtail with Docker or Docker Compose if you are evaluating, testing, or developing Loki. For production, Grafana recommends installing with Helm or Tanka. The configuration files associa
grafana.com
Getting Started | Building a RESTful Web Service with Spring Boot Actuator
You can run the application from the command line with Gradle or Maven. You can also build a single executable JAR file that contains all the necessary dependencies, classes, and resources and run that. Building an executable jar makes it easy to ship, ver
spring.io